Monitoring and remotely controlling servers
Ever since switching over from Docker Swarm to Kubernetes, monitoring has been an item hard-stuck on the TODO list. But recently my servers have been behaving strangely, with unpredictable crashes locking up multiple machines at the same time. That is why the priority of monitoring on the TODO list rose to the list that actually gets done.
To find out the issue, I needed two things:
- Logging to debug the issue
- Remote control to fix the issue whenever it occoured
Logging and monitoring is ofte suprisingly simple, as many users face this problem. There are many tools such as Grafana, Prometheus, Telegraf, etc. to collect/store/present data in real-time. I have yet to setup hardware logging (eg. CPU%, MEM%, temps), but I did setup Traefik’s built-in metric logging.
Remote control seems easy “Just use SSH!”; except that it doesn’t work when the server has a hard-crash that even prevents the DHCP client from working. Servers often have remote management tools built-in, where you can fully manage it over the network; even if the server itself is off. Such a tool is what I need, but then working with regular consumer hardware.
Traefik’s metrics
Traefik is a free reverse proxy which automatically connects entrypoints (HTTP, HTTPS, TCP port) to services (applications). In the case of HTTP(s) this works based on a set of rules the admin configures. The most common configuration is based on the HTTP Host header. That are a lot of words to say “I can use it to selectively expose applications in a neat way”.
An example of a Traefik IngressRoute can be seen below:
apiVersion: traefik.containo.us/v1alpha1
kind: IngressRoute
metadata:
  name: searx
  namespace: searx
spec:
  entryPoints:
    - websecure
  routes:
    - kind: Rule
      match: Host(`searx.ironsm4sh.nl`)
      priority: 10
      middlewares:
        - name: ratelimit-high
          namespace: traefik-system
        - name: compress
          namespace: traefik-system
        - name: hsts
          namespace: traefik-system
      services:
        - kind: Service
          name: searx
          namespace: searx
          passHostHeader: true
          port: 8080
          strategy: RoundRobin
          weight: 10
  tls:
    certResolver: letsencryptresolver
Where I declare the ingress for my searx instance. Any request on the websecure entrypoint (HTTPS) that matches the host searx.ironsm4sh.nl gets routed to the searx service on port 8080. This request uses a few custom middlewares, which add compression, ratelimits and enable HSTS.
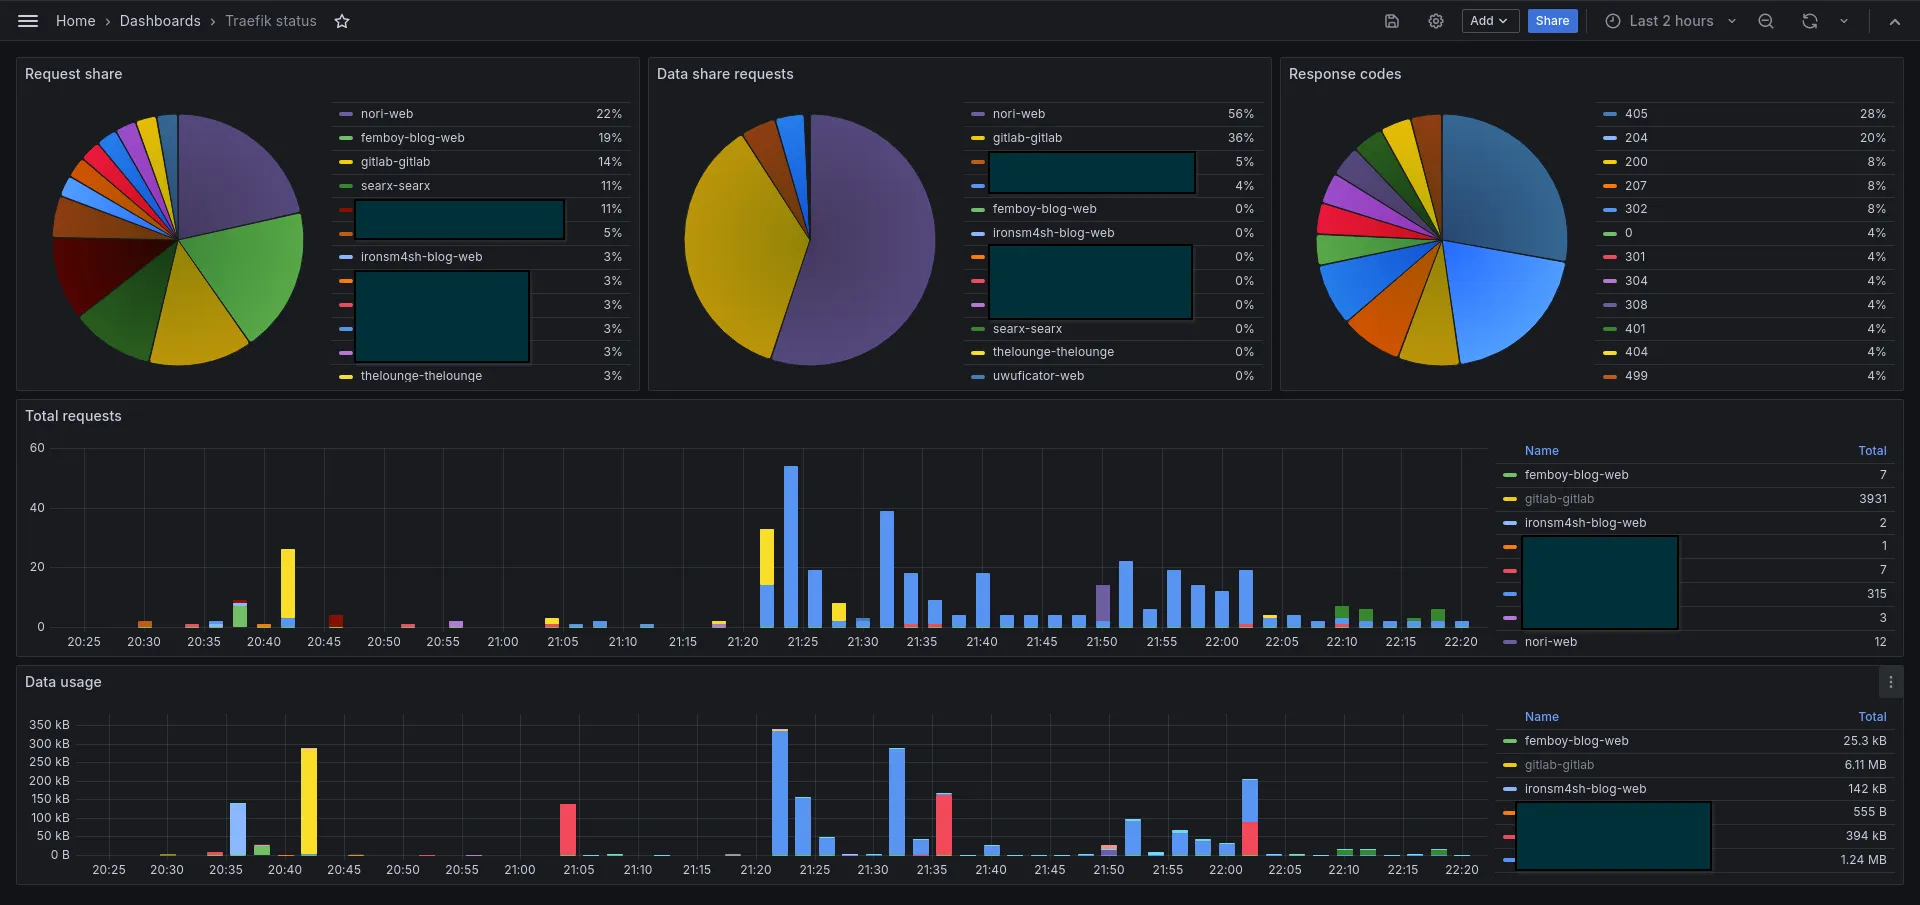
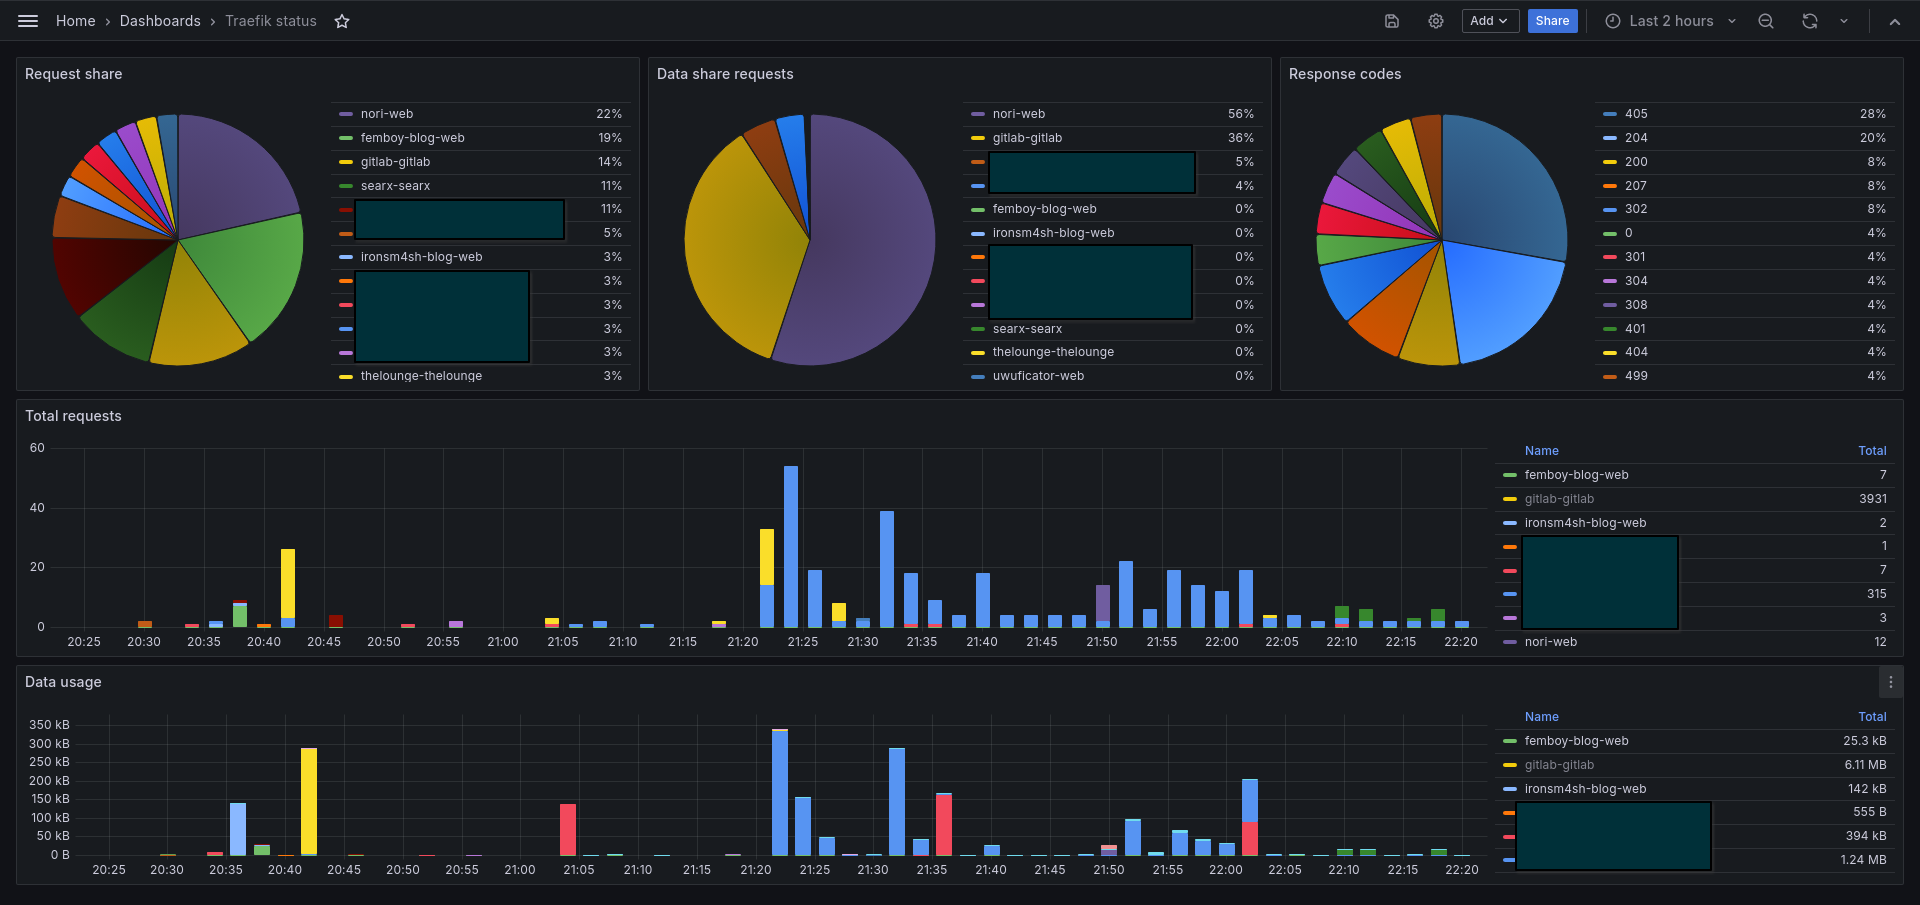
Because Traefik routes nearly all of my applications, it has access to a lot of data that gives insight to the users of my servers. Exposing them is as simple as picking a backend (InfluxDB2 in my case) and configuring it. Simply deploying an Grafana+InfluxDB instance, and adding a handful of traefik configs exports everything I need to give insights into my server. A quick dashboard that I created can be seen below (some internal items are hidden, sorry):
IPKVM
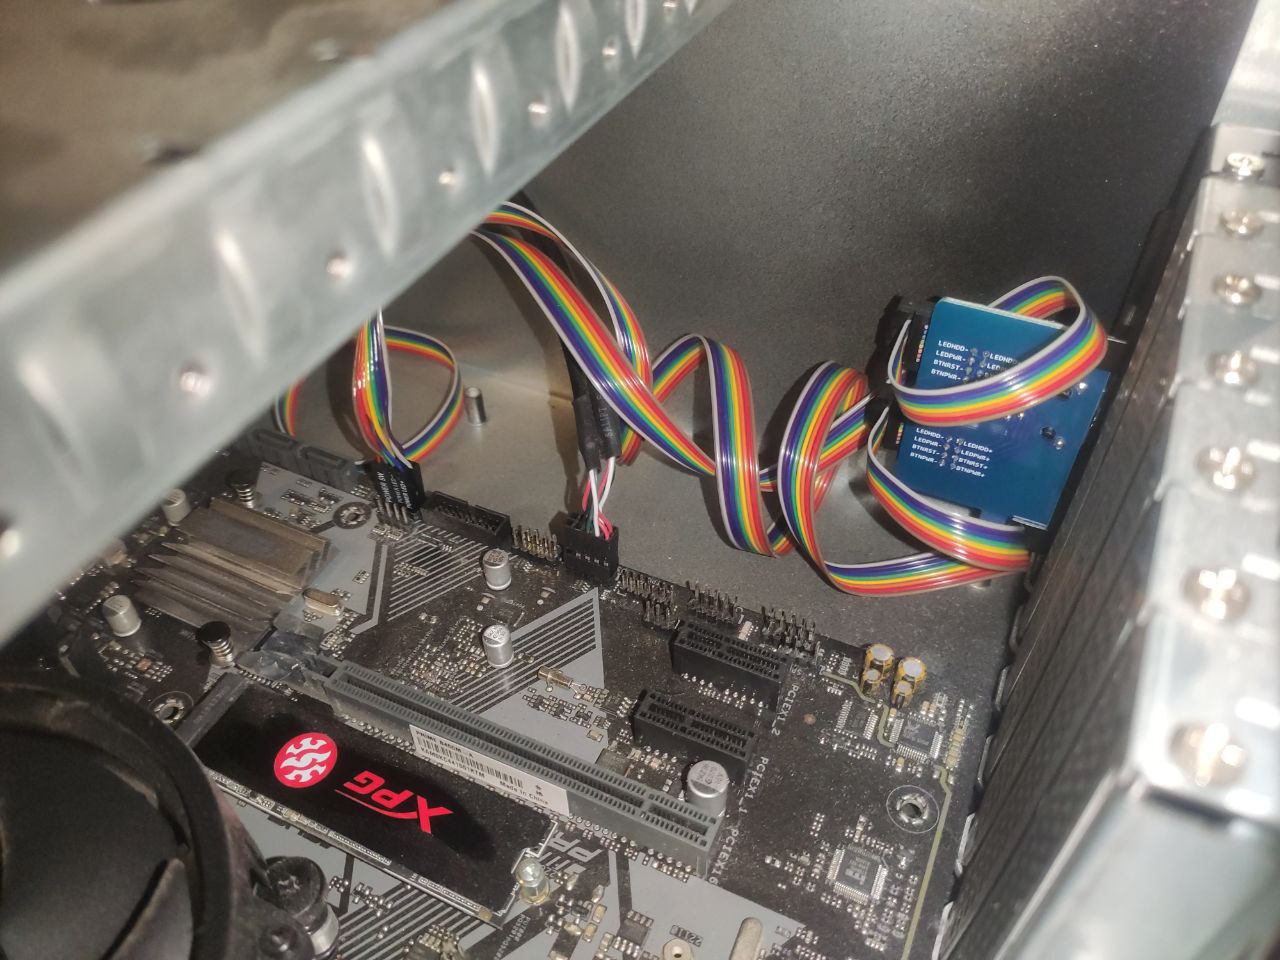
When it came to remote management, I cam across many blogposts, videos and recommendations of a project called the PiKVM which looked awesome. It also happend to be exactly what I needed. The only issue I had with the PiKVM, was that it was a small project itself. I simply do not have the time in the coming months to create a PiKVM. Luckily for me, a spinoff project the BliKVM exists which are fully free and ready-to-go modules you can purchase on AliExpress. So I bought two (one for each server node), and connected them to my servers in the rack.
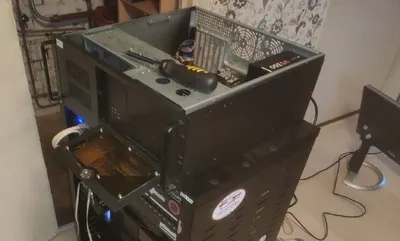
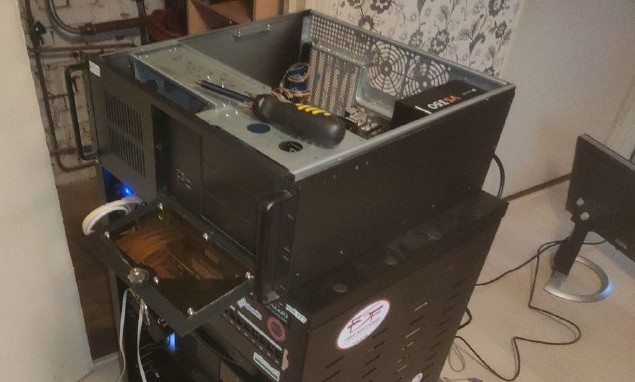

However, this turned out to be a debugging rabbit-hole. I have two identical hardware setups, and one of my servers just refused to work. Many hours were spend debugging using the good-old VGA monitor.
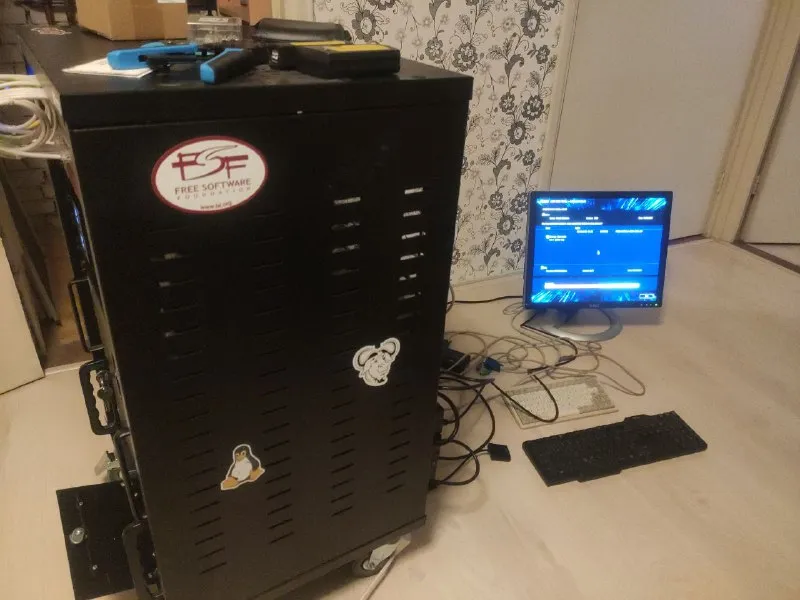
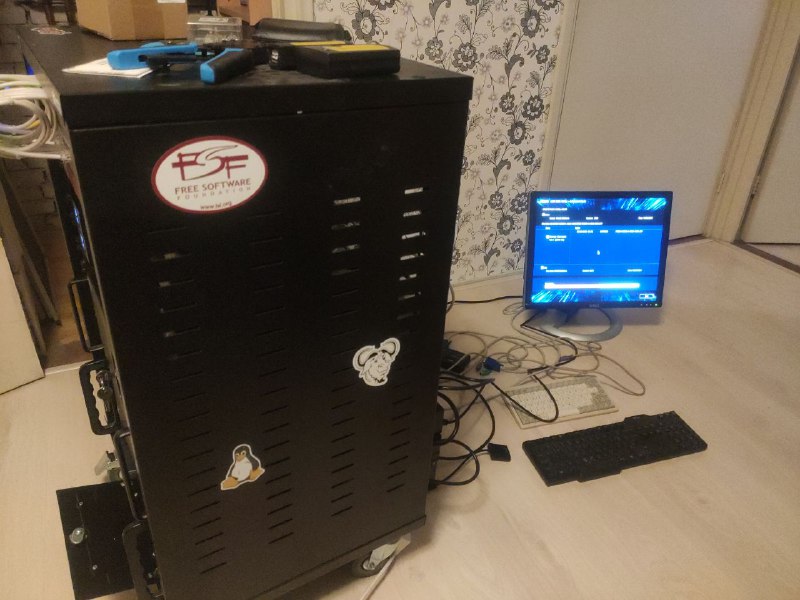
In the end it turned out that of of my servers is, for some reason, not installed as a UEFI OS, but as a plain old BIOS installation. Which for some weird reason prevents the onboard HDMI from working correctly. So fixing that up, and making both servers a working UEFI install is also added to the TODO list :)
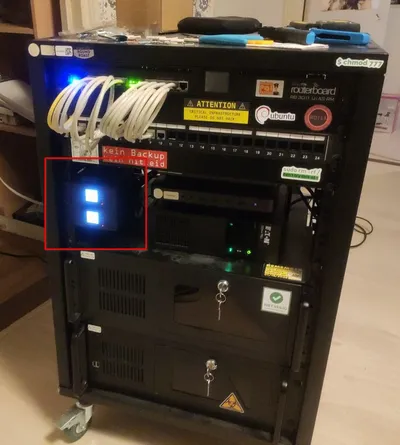
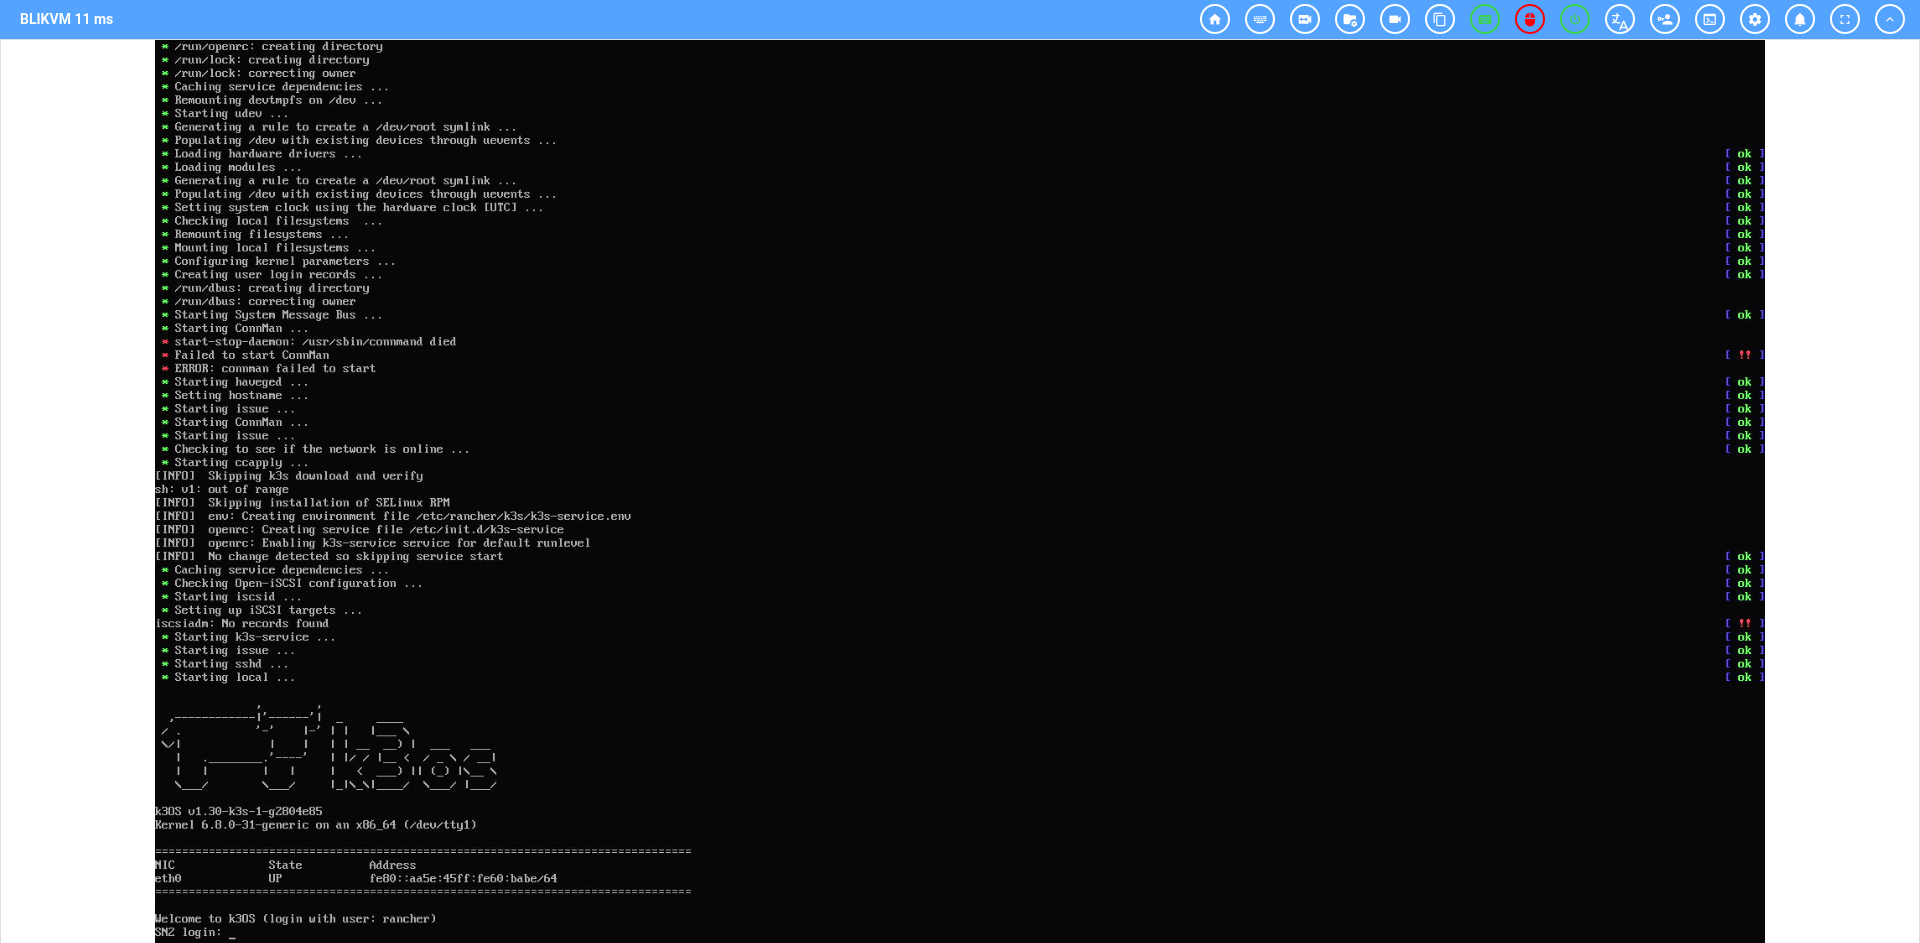
The working server’s BliKVM is really cool however; it worked out of the box. The only thing I did was connecting cables, and running a quick update. And well; the results speak for themselves: A fully working KVM over the network; keyboard, mouse, ATX power, and mass-storage emulation.

Whats next?
Over the course of the last few days, some items got removed from the TODO list, and others got added. It is really cool, and an improvement for sure. What is left, is adding additional logging (CPU%, MEM%, etc.) and switching one of my server’s installation over to UEFI. If you have any tips on switching to UEFI; please let me know.
Thank you for reading this article.If you spot any mistakes or if you would like to contact me, visit the contact page for more details.