OpenTelemetry in Dotnet
In the past few years, I’ve deployed many dotnet (webAPI) applications, such as NoriNote. When developing and deploying any application, its important to handle telemetry data such as logging properly. Logging can be very useful for understanding your application and debugging issues. My logging setup is typically very simple, because a basic logging solution comes batteries-included in docker and Kubernetes. This basic logging is usually enough for my private deployments. But there are many advanced solutions with useful features such as logstash, Graylog and Fluentd.
Logging is however not all telemetry data, other statistics such as metrics and traces are also important. A common setup for metrics is a combination of Prometheus and Grafana. Where Prometheus periodically scrapes data from different sources (through exporters) and stores them in its internal time-series DB, and Grafana has the capabilities to query and visualise the data. Traces often use a software product known as OpenTelemetry.
OpenTelemetry is a protocol and a SDK which aims to support the processing of all telemetry data (tracing, metrics, logs). But in practice, most users only use the tracing capabilities because logging is almost always built-in into a software stack and (generic!) metrics are often collected for each host. OpenTelemetry has support for Dotnet, and adding it to an existing application is trivial through the use of instrumentation. The instrumentation for Dotnet hooks into all kinds of ASP.NET methods to gather its information, the developer only has to enable it.
Deploying Jeager
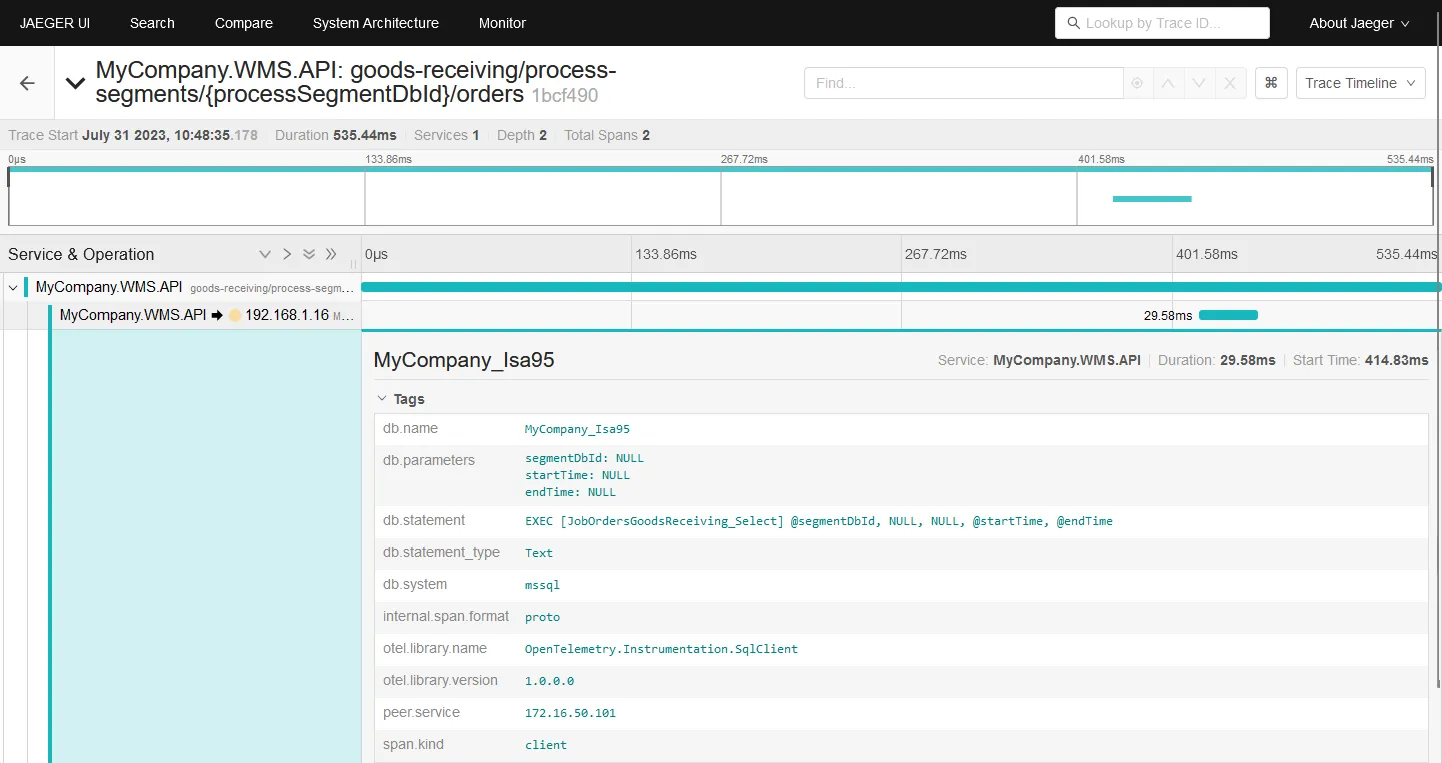
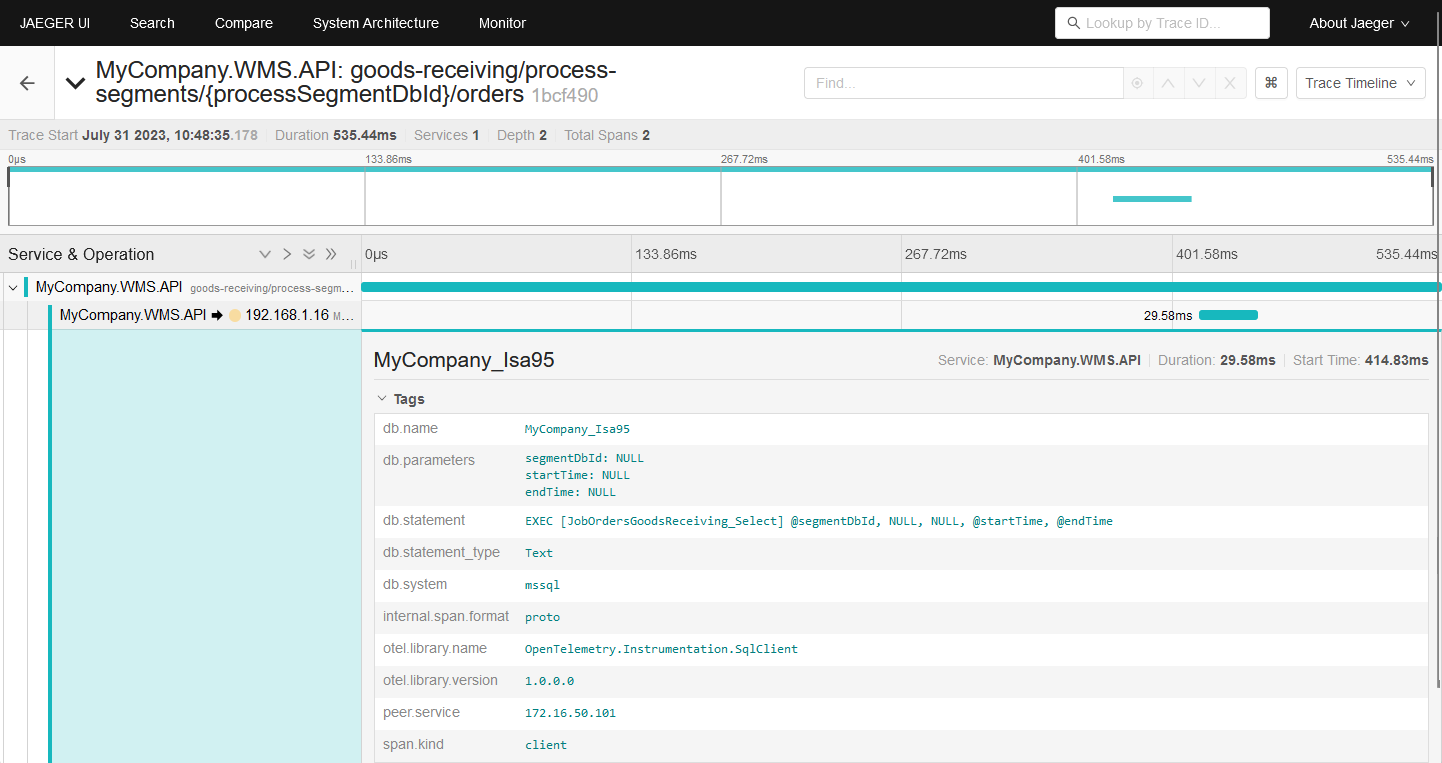
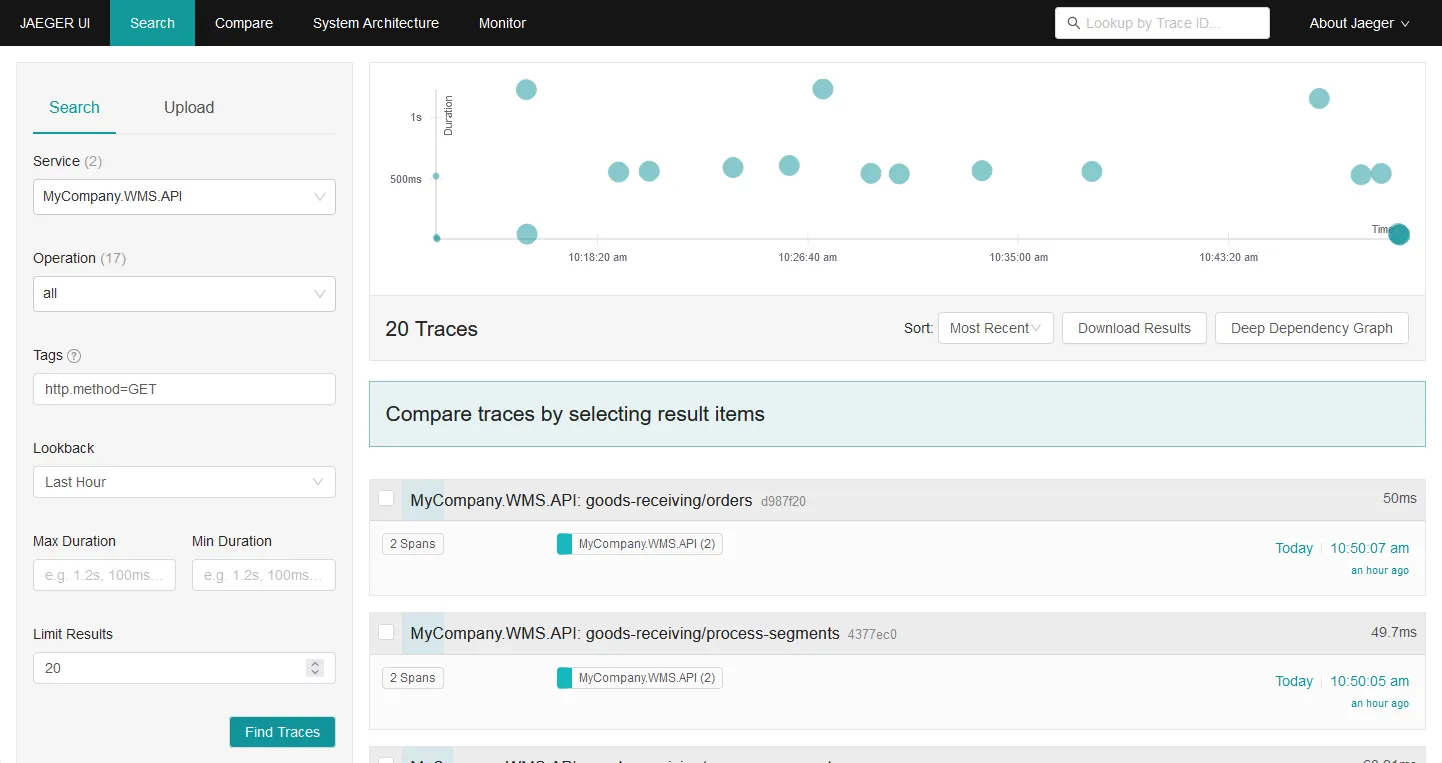
Jeager is a tool which supports OpenTelemetry, and can visualise traces for us. These traces are kind of like the network inspector in Chromium.
Deploying Jeager (for a demo setup!) is trivial using the jaegertracing/all-in-one OCI image. Simply create the following docker-compose file and deploy it using docker swarm/compose.
version: "3.7"
services:
  reverse-proxy:
    image: traefik:v2.2
    command:
      - "--api.insecure=true"
      - "--providers.docker=true"
      - "--providers.docker.endpoint=unix:///var/run/docker.sock"
      - "--providers.docker.exposedbydefault=false"
      - "--providers.docker.network=public"
      - "--entrypoints.web.address=:80"
    ports:
      - 80:80
      - 8080:8080
    volumes:
      - /var/run/docker.sock:/var/run/docker.sock:ro
    networks:
      - public
    labels:
      - "traefik.enable=true"
      - "traefik.http.routers.traefik.rule=Host(`traefik.local.gd`)"
      - "traefik.http.routers.traefik.entrypoints=web"
      - "traefik.http.services.traefik.loadbalancer.server.port=8080"

  # https://www.jaegertracing.io/docs/1.47/getting-started/
  jaeger:
    image: jaegertracing/all-in-one:1.47
    environment:
      - COLLECTOR_OTLP_ENABLED=true
    ports:
      - 5778:5778
      - 6831:6831/udp
      - 14268:14268
      - 4317:4317
    networks:
      - public
    labels:
      - "traefik.enable=true"
      - "traefik.http.routers.jaeger.rule=Host(`jaeger.local.gd`)"
      - "traefik.http.routers.jaeger.entrypoints=web"
      - "traefik.http.services.jaeger.loadbalancer.server.port=16686"

networks:
  public:
    external: true
After that, Jaeger should be up and running.

Adding OpenTelemetry to Dotnet
Adding OpenTelemetry to dotnet is very simple, you only need to add a few package references, and add their initialisation to the Program.cs (Or Startup.cs if you use two bootstrap files!)
The package references (This version may be very old at the time of reading):
<PackageReference Include="OpenTelemetry.Exporter.Jaeger" Version="1.5.1" />
<PackageReference Include="OpenTelemetry.Exporter.OpenTelemetryProtocol" Version="1.5.1" />
<PackageReference Include="OpenTelemetry.Extensions.Hosting" Version="1.5.1" />
<PackageReference Include="OpenTelemetry.Instrumentation.SqlClient" Version="1.5.1-beta.1" />
<PackageReference Include="OpenTelemetry.Instrumentation.AspNetCore" Version="1.5.1-beta.1" />
The code:
builder.Services.AddOpenTelemetry()
    .ConfigureResource(resource => resource
        .AddService(serviceName: builder.Environment.ApplicationName))
    .WithTracing(tracing => tracing
        .AddAspNetCoreInstrumentation()
        .AddSqlClientInstrumentation(config =>
        {
            config.SetDbStatementForStoredProcedure = true;
            config.SetDbStatementForText = true;
            // The following is optional, but adds all SQL parameters to the traces
            // so this _may_ store very sensitive data. Be careful!
            config.Enrich = (activity, eventName, rawObject) =>
            {
                if (rawObject is SqlCommand cmd)
                {
                    activity.SetTag("db.parameters", string.Join(
                        "\n",
                        cmd.Parameters.Cast<SqlParameter>().Select(
                            entry => $"{entry.ParameterName}: {(entry.Value == default ? "NULL" : $"\"{entry.Value}\"")}"
                        )
                    ));
                }
            };
        })
        .AddOtlpExporter(config =>
        {
            config.Endpoint = new Uri("http://jaeger.local.gd:4317");
            config.Protocol = OpenTelemetry.Exporter.OtlpExportProtocol.Grpc;
            config.ExportProcessorType = OpenTelemetry.ExportProcessorType.Simple;
        }));
And thats it! Full tracing support is implemented in the dotnet API. Ofcourse, you may want to add custom instrumentation for specific libraries or functionality. And the setup needs slightly more configuration when you have inter-service communication (such as with microservices).
If you spot any mistakes or if you would like to contact me, visit the contact page for more details.